Observing the Universe
Visible light spectral emission lines from sodium in a flame.
![]()
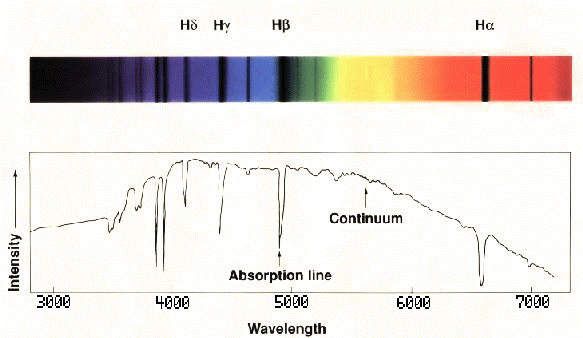
Examining the emission and absorbtion lines of chemical elements in the spectra of stars and galaxies has greatly contributed to our knowledge of the composition of the universe.
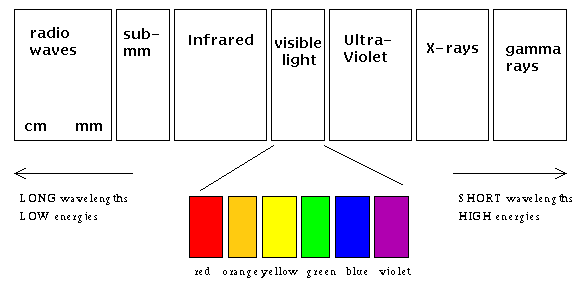
The Electromagnetic Spectrum
Stellar Spectra
Although astronomers have made eye observations in the visible light part of the EM-Spectrum for centuries, the ability to also examine galaxies and stars at wavelengths not accessible to the human eye has opened new windows of learning and understanding in the recent decades.
We may consider three principal types of spectra which appear when the light from an object is broken up into its component wavelengths or "dispersed":
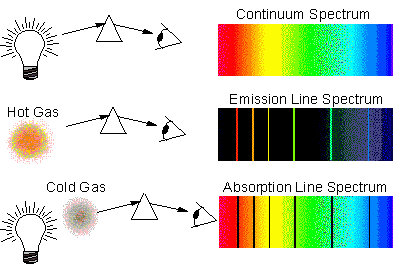
An absorption spectrum is produced when a continuum passes through "cooler" gas. Photons of the appropriate energies are absorbed by the atoms in the gas. Although the photons may be re-emitted, they are effectively removed from the beam of light, resulting in a dark or absorption feature. The atmospheres of stars act as a cooler blanket around the hotter interior of a star so that typical stellar spectra are absorption spectra.
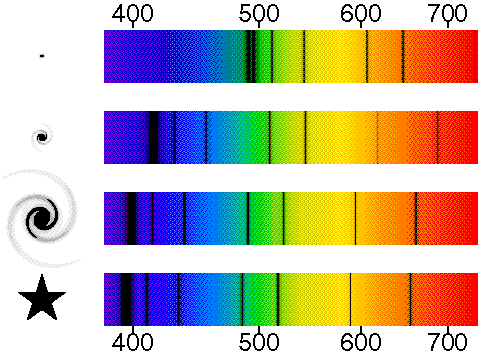
Light from moving objects will appear to have different wavelengths depending
on the relative motion of the source and the observer.

Observers looking at an object that is moving away from them see light that has
a longer wavelength than it had when it was emitted (a redshift), while
observers looking at an approaching source see light that is shifted to shorter
wavelength (a blueshift).
The schematic diagram below shows a galactic star at the bottom left with its
spectrum on the bottom right. The spectrum shows the dark absorption lines first
seen by Fraunhofer. These lines can be used to identify the chemical elements in
distant stars, but they also tell us the radial velocity. The other three
spectra and pictures from bottom to top show a nearby galaxy, a medium distance
galaxy, and a distant galaxy. The pictures on the left are negatives, of course,
so the brightest parts of the galaxies are black. Notice how the pattern of
absorption lines shifts to the red as the galaxies get fainter. The numbers
above and below the spectra are the measured wavelengths in nm [nanometers].
In 1914 Vesto Slipher (lived 1870--1963) announced his results from the spectra of over 40 spiral galaxies (at his time people thought the ``spiral nebulae'' were inside the Milky Way). He found that over 90% of the spectra showed redshifts which meant that they were moving away from us. Edwin Hubble and Milton Humason found distances to the spiral nebulae. When Hubble plotted the redshift vs. the distance of the galaxies, he found a surprising relation: more distant galaxies are moving faster away from us. Hubble and Humason announced their result in 1931: the recession speed = H × distance, where H is a number now called the Hubble constant. This relation is called the Hubble Law and the Hubble constant is the slope of the line. The line goes through the origin (0,0) because that represents our home position (zero distance) and we are not moving away from ourselves (zero speed).
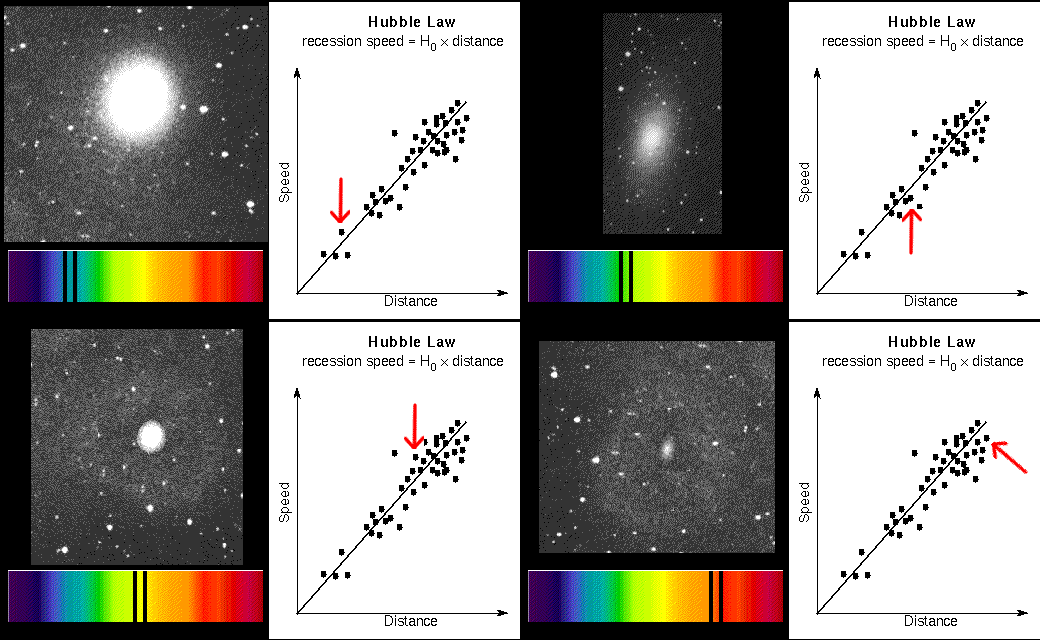
More distant galaxy has greater redshift.
If the distance is measured in units of megaparsecs (Mpc) and the recession speed is in kilometers/second (km/sec), the Hubble constant (slope of the line) is between 60 and 70 km/sec/Mpc. This value is found by using the galaxies that have accurate distances measured (Cepheids, etc.) and dividing their recession speeds by their distances. It is easy to find the recession speeds of galaxies from their redshifts. The Hubble law provides an easy way to measure the distances to even the farthest galaxies from the (recession speed/H). For example, if a galaxy has a redshift of 20,000 km/sec and H is set to 70 km/sec/Mpc, then the galaxy's distance = (20,000 km/sec)/(70 km/sec/Mpc) = 20,000/70 × [(km/sec)/(km/sec)] Mpc = 286 megaparsecs.